
The Filtration Efficiency of Single-Layer Textiles for Respiratory protection
Abstract
Due to the increasing number of corona cases and the face mask industry's associated bottleneck, this work focuses on the various single-layer textiles used as cloth masks. The purpose of this work is to test ten different single-layer textiles for their suitability as face masks. All tests in this work were carried out based on the ASTM F2299 and the new ASTM Standard for barrier masks (3502-21). The new standard offers a more precisely defined test protocol and is consistent with how respirators are tested.
The results show that only one of the ten textiles tested meets the ASTM requirements for a barrier mask. We also include data for ASTM F2299 and report the results for unneutralized challenge particles at various face velocities for the same single-layer textiles. These results are different from those of the ASTM 3502 because the particle size and the procedure used are different. Under ASTM 3502, the resistance values are significantly higher, and the efficiency values are significantly lower than those reported by using the ASTM F2299.
Citation
Pourdeyhimi B, Schick S, Groten R. (2021). The Filtration Efficiency of Single-Layer Textiles for Respiratory protection. Journal of Science and Medicine; 3(2):1-12. https://doi.org/10.37714/josam.v2i4.80.
Introduction
As already discussed in an earlier paper dealing with the respiratory effectiveness of cloth masks [1], the use of cloth mask extends back to the 19th century and has evolved from simple single layers cotton gauge to modern multi-layered masks using charged meltblown filters protected by layers or spunbond. As early as 2010, it was predicted that there would be a global shortage of masks in a pandemic crisis [2]. The same study evaluated the effectiveness of various forms of cloth masks. The materials included T-shirts, towels, and scarves. These tests were carried out with a view to establish if cloth masks would be effective in case of a shortage during a pandemic. In addition to the polydisperse penetration tests (TSI 8130), monodisperse fractional efficiency tests were also conducted (TSI 3160) to examine the filtration efficiency at various particle sizes and establish the most penetrating particle size (MPPS). The tests were performed at a face velocity of 5.5 cm/s (33 l/min) and 16.5 cm/s (99 l/min) for a sample size measuring 100 cm2.
Face velocity is defined as:
Thus, the flow rate and the area of the specimen define the face velocity.
The flow rate for testing N95 respirators is 85 l/min, and since the area of masks vary, the face velocity is not constant. The smallest masks are the classical cup-shaped masks with a surface area of ~ 140 cm2. The largest masks are the duckbill style which can measure as much as 250 cm2. Thus, the face velocities would be in the range of 5.7 cm/s to 10.1 cm/s. For a cloth mask, it would be reasonable to assume that the surface area is large and therefore, the lower face velocity would offer a more realistic measure of the performance. A higher face velocity would of course lead to a higher pressure drop and lower efficiency.
The study also used a classical N95 respirator as a control and tested under the same conditions. For polydisperse particles, a penetration of 40-90% and monodisperse particles (from 20-1000 nm), a penetration of 40-97% were observed for the textiles tested.
As anticipated, regardless of the face velocity, a significantly higher penetration was observed for the textile materials compared to the N95 respirator. The conclusion was that the textile material tested only offered marginal protection against submicron particles.
During the past year, there have been many cloth masks offerings with misleading labels. Many reported the bacteria filtration efficiency (BFC) results (ASTM F2101-19) while a few reported the latex 0.1 micron particle capture efficiency (PFC) results (ASTM F2299). Neither one of these is a good measure of the respiratory protection in that both overestimate the effectiveness of the mask.
In this study, we take a deeper look into the idea of repurposing single-layer textiles from everyday use.
Materials and Methods
In this study, 10 textile fabrics were selected (see Table 1). The selection represents the broadest range of materials that are readily and commercially available to the consumers. Nonwovens are not as easily and readily available to consumers since they are not generally used in reusable, launderable products, and are not sold in fabric stores and what is offered online is primarily spunbond and needle punched (felt) fabrics used as a secondary material for apparel and home furnishings. The materials were purchased from JoeAnn fabrics ().
| Sample Name | Sample Code | Textile Structure |
| Sew Classic Linen | 1 | Woven |
| Sew Classic Micro-suede | 2 | Woven |
| Double brushed Polyester | 3 | Knit |
| Performance Nylon-Spandex | 4 | Knit |
| Silky Solids Stretch Chiffon | 5 | Woven |
| Sportswear Denim Stretch | 6 | Woven |
| Posh Lining | 7 | Woven |
| Swim & Dance Knit Mystique | 8 | Knit |
| Interlock Knit | 9 | Knit |
| Sportwear Quilted Stretch | 10 | Velour Knit |
All materials were tested for their structural properties (thickness, weight, air permeability, and fiber content).
For the evaluation of filtration performance, two ASTM test methods were followed.
The first is the ASTM F2299. It is well documented that this test method does not provide a specific test protocol but rather defines a range for particle sizes to be used as well as a range of face velocities. This has led to inconsistencies in measuring the performance of various materials. ASTM F2299 specifies the use of charged neutralized particles. The FDA Guidance document recommends the use of unneutralized particles at 0.1 micron. However, FDA would also accept results for charge neutralized particles as these are more difficult to capture compered to charged particles. There are no standard pieces of equipment also available for performing this test. Most companies have built their own.
In contrast, the new ASTM 3502 Barrier Face Mask standard is quite specific. It uses a TSI 8130 (same equipment used for NIOSH certification) and the face velocities are standardized. The particle size is ~ 0.3 micron which is close to the most penetrating particle size. These are summarized below in Table 2:
| (PFE) ASTM F2299 | (PFE) FDA Guidelines | (PFE) ASTM 3502 | |
| Filter Area [cm 2 ] | Not Specified | Not Specified | Not Specified |
| Flow Rate [l/min] | Not Specified | Not Specified | 60 for flat sheets85 if mask can be mounted |
| Face Velocity [ cm/s] | 0.5 to 25 | Not Specified | 10.0 |
| Particle Size [µm] | 0.1 to 5 | 0.1 | 0.3 |
| Particle Charge | Neutralized | Unneutralized | Neutralized |
The flow rates used were 32 l/min, 60 l/min, and 85 l/min to examine the role of flow rate (face velocity) on the filtration performance of the materials uses.
Measurement of PFE according to ASTM F2299
As indicated earlier, there are no standard pieces of equipment that can be used for measuring the 0.1 micron PFE per ASTM F2299. For this purpose, we use a TSI 3160 fractional efficiency tester and use 0.1 monodisperse latex particles. One advantage of the TSI 3160 is that it is equipped with a neutralizer that can be turned on or off and therefore, one can measure charge neutralized and unneutralized particle efficiency.
Note this test method is not intended for cloth masks and applied to medical (surgical/procedural) masks. For Class I, a PFE of at least 95% is required while for Classes II and III, the PFE needs to be at least 98%.
The filtration tests were carried out with three different face velocities (5,33; 10; 14.17 cm/s). The tests were performed with both unneutralized and neutralized particles.
For comparison purposes, we also used the TSI 8130 (at ~0.3 microns) with neutralized particles at the same flow rates. This is intended to show and highlight any differences due to the particle size used for the test.
Measurement of PFE according to ASTM 3502
ASTM 3502 uses TSI 8130 or 8130A for the measurement of PFE which is close to the most penetrating particle size (~0.3 microns). As shown above, if the mask can be mounted, the flow rate will be set at 85 l/min while for flat sheets, 60 l/min will be required to achieve a face velocity of 10 cm/s for a sample measuring 100 cm2.
The Barrier mask defines two performance levels (Table 3).
Note that the mask does not have to meet both requirements defined under each level. That is, a mask can be classified as having a level I filtration efficiency but with a performance at level II for pressure drop.
| Performance Property | Level I | Level 2 |
| Sub-micron Particulate Efficiency (%) | ≥ 20 | ≥ 50 |
| Air Flow Resistance, Inhalation (mm H2O) | ≤ 15 | ≤ 5 |
| Air Flow Resistance, Inhalation (Pascals) | ≤ 147.15 | ≤ 49.05 |
The flow rates used were 32 l/min, 60 l/min, and 85 l/min to examine the role of flow rate (face velocity) on the filtration performance of the materials uses.
Measurement of Fractional Efficiency
If samples showed an efficiency of 20% or higher with a resistance less than 147 Pa (15 mm H2O), they were tested for their fractional efficiency on a TSI 3160. TSI 3160 allows the particle sizes of interest to be selected. In this study, the particles selected were 0.05; 0.08; 0.1; 0.2; 0.28; 0.33 and 0.4 µm. The diameter of the coronavirus is ~ 60-140 nm [3]; therefor, the selected particle diameter in this test covers the area of the virus and beyond. As noted earlier, this test protocol also will determine the most penetrating particle size (MPPS) for the media tested as well. Note that in many charged media, the MPPS can be less than 0.3 microns and therefore, it is considered essential to establish the MPPS.
Results and Discussion
The structural characteristics for the materials tested are summarized in Table 4.
Note that the set includes woven fabrics, knitted fabrics as well as a knitted stretch velour. The velour was selected because it has a much higher thickness.
| Code | Sample Name | Textile Structure | Weight (g/m 2 ) | Thickness (mm) | Air Permeability (m 3 /min/m 2 ) |
| 1 | Sew Classic Linen | Woven | 224.9 ± 4.3 | 0.426 ± 0.013 | 23.33 ± 2.81 |
| 2 | Sew Classic Micro-suede | Woven | 136.4 ± 2.1 | 0.382 ± 0.026 | 8.54 ± 0.27 |
| 3 | Double brushed Polyester | Knit | 216.0 ± 3.7 | 0.722 ± 0.018 | 13.41 ± 1.10 |
| 4 | Nylon-Spandex | Knit | 168.6 ± 2.7 | 0.620 ± 0.001 | 79.46 ± 1.09 |
| 5 | Silky Stretch Chiffon | Woven | 84.5 ± 3.1 | 0.192 ± 0.010 | 15.21 ± 1.38 |
| 6 | Sportswear Denim Stretch | Woven | 225.3± 3.5 | 0.544 ± 0.016 | 2.96 ± 0.18 |
| 7 | Posh Lining | Woven | 59.4 ± 1.1 | 0.140 ± 0.001 | 37.49 ± 2.28 |
| 8 | Swim & Dance Knit | Knit | 212.6 ± 5.6 | 0.426 ± 0.013 | 25.61 ± 1.81 |
| 9 | Interlock Knit | Knit | 208.5 ± 4.3 | 1.002 ± 0.027 | 67.42 ± 4.00 |
| 10 | Quilted Stretch | Velour | 383.6 ± 4.4 | 2.872 ± 0.168 | 56.11 ± 2.42 |
It may be noted that the knitted structures are heavier, have a higher bulk and thickness generally, and consequently have a high permeability in general. The velour structure has the highest thickness, but not the highest permeability. The knitted sample with the highest permeability is the Nylon-Spandex fabric that can easily stretch. This is potentially why it shows a higher air perm compared to the other structures. Note as that in most textiles, the fibers are in the range of 15 to 30 microns in diameter.
The analysis of fiber content is summarized and shown in Table 5. Note that the label information for sample 1 indicated that it consisted of a Cotton/Rayon mix; this could not be determined, and we, therefore, use a 50/50 ratio as an estimate for calculating the fabric density.
| Code | Sample Name | Cotton (wt. %) | PET [wt. %] | Nylon [wt.%] | Spandex [wt. %] |
| 1 | Sew Classic Linen | 100% | - | - | - |
| 2 | Sew Classic Micro-suede | - | 100 | - | - |
| 5 | Silky Stretch Chiffon | - | 91 | - | 9 |
| 6 | Sportswear Denim Stretch | 71 | 25 | - | 4 |
| 7 | Posh Lining | - | 100 | - | - |
| 3 | Double brushed Polyester | - | 89 | - | 11 |
| 4 | Nylon-Spandex | - | - | 83 | 17 |
| 8 | Swim & Dance Knit | - | 89 | - | 11 |
| 9 | Interlock Knit | 56 | 44 | - | - |
| 10 | Quilted Stretch | - | 91 | - | 9 |
The true fabric density is defined as the density of the fabric divided by the density of the fiber. The calculated porosity of the fabric (taking into account fiber content) is shown in Table 6.
| Code | Sample Name | Fabric Density (g/cm 3 ) | True Fabric Solidity (%) | Fabric Porosity (%) |
| 1 | Sew Classic Linen | 0.528 | 34% | 66% |
| 2 | Sew Classic Micro-suede | 0.357 | 26% | 74% |
| 5 | Silky Stretch Chiffon | 0.440 | 32% | 68% |
| 6 | Sportswear Denim Stretch | 0.414 | 27% | 73% |
| 7 | Posh Lining | 0.424 | 31% | 69% |
| 3 | Double brushed Polyester | 0.299 | 21% | 79% |
| 4 | Nylon-Spandex | 0.270 | 20% | 80% |
| 8 | Swim & Dance Knit | 0.499 | 36% | 64% |
| 9 | Interlock Knit | 0.208 | 14% | 86% |
| 10 | Quilted Stretch | 0.134 | 10% | 90% |
Note that the velour sample has the highest porosity followed by the interlock knit. The interlock structure contains large pores, and it is not surprising that the structure exhibits high porosity.
Fabric porosity is plotted against the air permeability values and is shown in figure 1 below.
figure 1.Fabric Porosity vs. Permeability
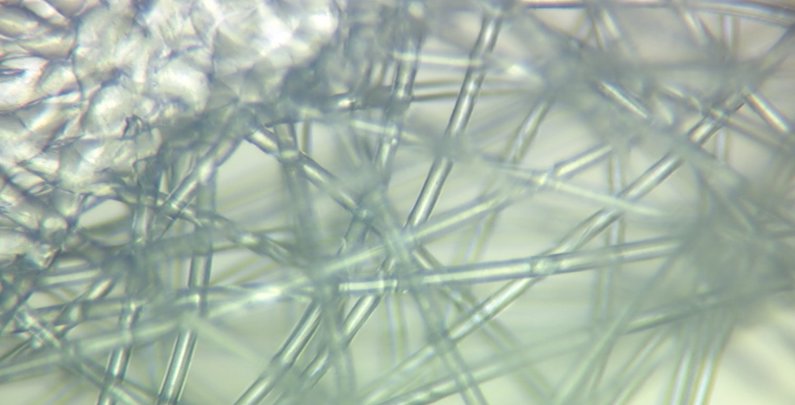
It may be noted that as expected, air permeability increases with porosity. Note however, that structure deformation can also contribute to the air permeability values obtained especially in the case of structures that can easily stretch and deform under pressure. The higher air permeability is obtained for the nylon spandex sample which is designed to stretch easily. The scatter in the data is also indicative of the general variations in texture, pore size, and thickness in these samples. Most every-day textiles are almost planar structures with large pores. Generally, woven fabrics can be designed to be tightly woven and offer the highest density and lowest permeability. While they may offer better particle capture, their pressure drop will be very high. In contrast nonwoven structures used for filtration are made up of fibers that are primarily sub-micron. He structures are psudo-3D layered planer structures and since the fibers are more or less randomly laid, there is no distinct pore. The pores are essentially a bundle of capillaries with a very tortious path – in fact, tortuosity is a measure of the complexity of the pore shape in nonwovens and this can impact properties such as air flow, fluid flow, and particle capture. In addition, the fibers are electrostatically charged, and this coupled with the high surface area (small fibers) and high tortuosity leads to efficient capture of particles. An example nonwoven structure after it has been subjected to dust loading (several minutes of insult by particles) is shown in figure 2. Note that the structure has efficiently captured the particles due to reasons outlined above.
figure 2.A nonwoven Structure After Dust Loading [4]
ASTM F2299 PFE (0.1 micron)
It will be recalled that the filtration tests were carried out on a TSI 3160 at three different face velocities (5.33; 10.00; 14.17 cm/s) with both unneutralized and neutralized challenge monodisperse latex particles at 0.1 micron. It will also be recalled that we carry out tests on the TSI 8130 at the same flow rates with neutralized particles that are ~ 0.3 microns.
In ranking these samples, we set the bar very low and use the ASTM 3502 lower level as the guideline. The lower level is 20% efficiency (80% penetration) and 15 mm H2O pressure drop (147.1 Pa).
We plot all samples together to highlight any similarities or dissimilarities. The Max penetration of 80 % (horizontal axis), and max resistance at 147.1 Pa (vertical axis) help visualize where the samples lie with respect to this ranking. The plots show all 3 flow rates used for this test in figure 3.
The plot shows on the y-axis, penetration in %, and on the x-axis, resistance in Pa. The plot consists of three horizontal regions highlighted in different colors. The first row from the top shows the data of TSI 8130 (data points in red). The second and third rows show the latex particle test at 0.1 microns (data points in blue) for neutralized and unneutralized particles respectively.
There are also 3 vertical regions separated by black lines that show the data for the 3 different flow rates used.
For simplicity, the x-axis was limited to a value 300 Pa since we had set the upper limit of the resistance as 147,1 Pa. Values above are not desirable and not plotted.
figure 3.Penetration vs. Resistance Overview
Focusing on the latex particle test per ASTM F2299 (second and third regions from the top; data in blue) one can immediately see that the particle charge neutralization has a significant influence on the filter properties. Neutralized particles show a higher penetration as expected. See for example, sample 2 (“X”) where the penetration value is around 10% lower when tested with unneutralized particles (third row, first diagram) than with neutralized particles (second row, first diagram). A similar trend is observed for most samples although at higher face velocities the difference is reduced.
Interestingly, if we use the teachings of the new ASTM 3502 standard and use a face velocity of 10 cm/s, then only sample X will qualify as having an acceptable efficiency of 20% and a pressure drop of lower than 147 Pa. Even though we have set the bar extremely, low, only one sample can achieve this goal.
Note also that if we use the 8130 at the same flow rate and face velocity, the results do not change dramatically. Again, only sample 2 (“X”) meets this low barrier requirement. However, the sample samples tested on the TSI 3160 show a higher pressure drop. Note that the ASTM F2299 has a very low concentration of particles and therefore, the sample has little chance of increasing its pressure drop as it is being loaded.
The sample 2 (“X”) was therefore, selected for the fractional efficiency test. Ten replicates were tested at various particle sizes. The results can be seen below in figure 4.
figure 4.Penetration vs. Particle diameter in micron for Sample 2
The behavior is classic in that the penetration is lower at lower particle sizes and maximizes at around 0.3 microns which represents the most penetrating particle size (MPPS) for mechanical filters (without charge). The highest value for the penetration was at a particle diameter of 0.28 µm. This is very close to what TSI 8130 measures. Note also that the penetration at 0.1 micron is much lower than that of 0.3 micron.
Summary and Conclusion:
Of the ten tested textiles, nine are unsuitable for the use as a face mask even at a low efficiency of 20% and a pressure drop of 147 Pa. Most materials showed a pressure drop that was more than the target of 147 Pa. While there is a correlation between air permeability and porosity, different constructions can lead to large macro pores that would limit their ability in capturing particles. Sample 2 is a more closed structure and shows rather low air permeability. However, it is micro-sueded, and this makes small fibers available on the surface, potentially covering the larger macro pores and this seems to aid in its filtration performance.
The fractional efficiency performed for sample 2 confirms the results obtained by TSI 8130. The MPPS for sample 2 was close to what TSI 8130 measures.
This study confirms earlier results that normal textiles are unsuitable for facemasks and at best offer a minimal degree of respiratory protection.
Statement of Conflict of Interest
The author has no financial or commercial interest in any of the material presented in this report and claim no intellectual priority or rights. This information is offered entirely in the public interest, without restriction or limitation.
Due to the increasing number of corona cases and the face mask industry's associated bottleneck, this work focuses on the various single-layer textiles used as cloth masks. The purpose of this work is to test ten different single-layer textiles for their suitability as face masks. All tests in this work were carried out based on the ASTM F2299 and the new ASTM Standard for barrier masks (3502-21). The new standard offers a more precisely defined test protocol and is consistent with how respirators are tested.
The results show that only one of the ten textiles tested meats the ASTM requirements for a barrier mask. We also include data for ASTM F2299, and report the results for unneutralized challenge particles at various face velocities for the same single-layer textiles. These results are different from those of the ASTM 3502 because the particle size and the procedure used is different. Under ASTM 3502, the resistance values are significantly higher, and the efficiency values are significantly lower than those reported by using the ASTM F2299.
Relevant Links to FDA, CDC, and NIH advice on the reuse of N95 respirators
US FDA advice on N95 Respirators and Surgical Masks (Face Masks)
https://www.fda.gov/medical-devices/personal-protective-equipment-infection-control/n95-respirators-and-surgical-masks-face-masks
Pre-print of article: Assessment of N95 respirator decontamination and re-use for SARS-CoV-2
https://www.medrxiv.org/content/10.1101/2020.04.11.20062018v1
CDC infographic on N95 respirators versus surgical masks
FDA Guidance
Appendix A to §1910.134—Fit Testing Procedures (Mandatory)
References
- Pourdeyhimi Behnam, Schick Simon, Groten Robert, Vahedi Tafreshi Hooman. Respiratory Effectiveness of Cloth Masks. The Journal of Science and Medicine. 2021; 2(4)DOI
- Simple Respiratory Protection—Evaluation of the Filtration Performance of Cloth Masks and Common Fabric Materials Against 20–1000 nm Size Particles. The Annals of Occupational Hygiene. 2010. DOI
- Zhu Na, Zhang Dingyu, Wang Wenling, Li Xingwang, Yang Bo, Song Jingdong, Zhao Xiang, Huang Baoying, Shi Weifeng, Lu Roujian, Niu Peihua, Zhan Faxian, Ma Xuejun, Wang Dayan, Xu Wenbo, Wu Guizhen, Gao George F., Tan Wenjie. A Novel Coronavirus from Patients with Pneumonia in China, 2019. New England Journal of Medicine. 2020; 382(8)DOI
- Song Yu, Shim Eunkyoung. Structure characterization of the clogging process of coarse fibrous filter media during solid particle loading with X-ray micro-computed tomography. Separation and Purification Technology. 2021; 273DOI